
Data in table form is one of the most important tools for scientists. Whether it is a list of patient information in medicine, survey results in the social sciences, or artifact records in archaeology, tables help researchers organize and analyze information. But there’s a problem: raw tables are often difficult to read, confusing to navigate, and hard to share effectively.
For example, when researchers exchange large spreadsheets, important context is often lost. The data may not be interactive users can’t sort, filter, or explore relationships between entries. Traditional visualization tools, such as R Shiny, can solve some of these issues by turning data into interactive dashboards. However, these tools usually require programming knowledge, technical expertise, or additional software installations.
To address this challenge, the Institute for Artificial Intelligence in Medicine (IKIM) at the University of Duisburg-Essen has developed a powerful yet user-friendly solution: Datavzrd. This open-source tool converts plain tables into interactive, visually appealing HTML reports and it requires no coding skills or special software. The research behind Datavzrd was recently published in the scientific journal PLOS One.
What Makes Datavzrd Unique??
The strength of Datavzrd lies in its simplicity and accessibility.
- No programming required – Users don’t need to write code. Instead, they describe their desired report in a straightforward text file, similar to filling out a profile. This file specifies what data should be displayed and how it should look.
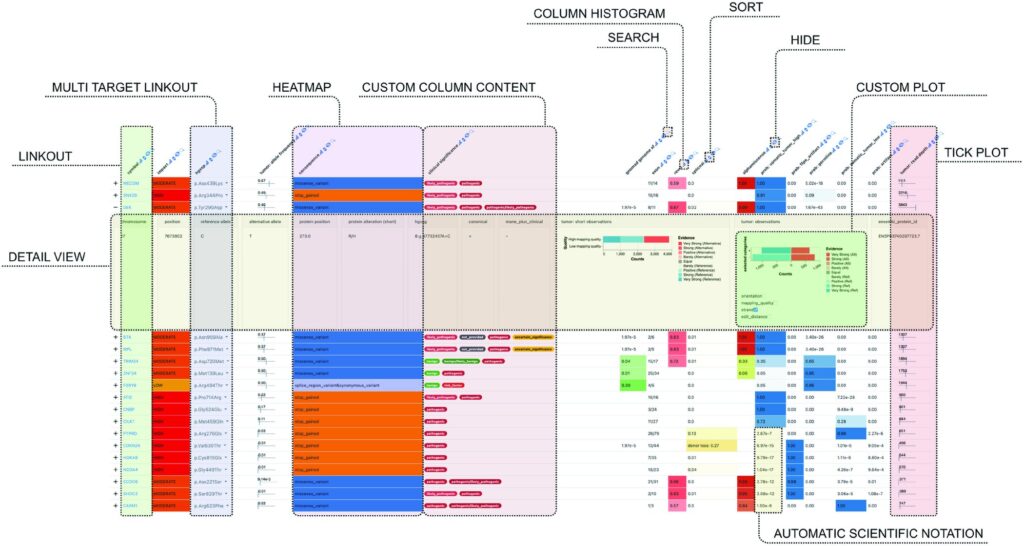
- Fully interactive – The generated reports allow users to filter, sort, and link data entries directly in their browser.
- Lightweight and portable – Reports can be opened locally in any modern browser, sent by email, or included as supplementary files in research papers.
- Handles massive data – Unlike many other tools, Datavzrd can process millions of rows without performance issues.
- Low maintenance – Once created, reports don’t require ongoing updates, installations, or additional software.
“The big advantage of Datavzrd is that it is particularly user-friendly and low-maintenance,” explains Felix Wiegand, a computer scientist at IKIM who contributed to its development.
More Than Just Tables
While Datavzrd focuses on tables, its features go far beyond static spreadsheets. Users can:
- Explore relationships between datasets – For example, a primary table can be linked with secondary tables, allowing navigation through hierarchies or cross-referencing related entries.
- Maintain context and clarity when sharing data – Instead of sending a raw spreadsheet where context is often lost, Datavzrd preserves meaning by embedding relationships, filters, and metadata directly in the report.
- Customize presentation – With a few instructions in the configuration file, users decide what information is shown and how it is displayed, giving them control without requiring technical expertise.
A tutorial provided by the developers makes it easy even for beginners to get started.
Real-World Applications
The team at IKIM has already demonstrated Datavzrd’s usefulness in different research areas:
- Medical Research – In molecular tumor boards, where doctors and researchers discuss patient-specific cancer cases, Datavzrd was used to present genetic findings and therapy options interactively. This allows medical professionals to quickly navigate through complex datasets and make informed decisions.
- Archaeology – In another case study, researchers used Datavzrd to analyze and present decorated clothing elements found at archaeological sites. The tool helped them compare items from different locations in a clear, connected format, making patterns easier to identify.
These examples highlight the versatility of Datavzrd—it can handle both highly technical medical data and cultural heritage research with equal ease
A Tool for All Disciplines
“Datavzrd makes data-based results intuitive, flexible, and sustainable,” says Wiegand. “It is suitable for almost all disciplines and scientific fields—from research and teaching to evaluation.”
Indeed, any field that relies on tables—from biology to economics—can benefit from this tool. By making data interactive, shareable, and easy to understand, Datavzrd removes barriers that often stand between raw information and meaningful insights.
In today’s world, datasets are only getting bigger and more complex. Scientists and professionals need tools that can bridge the gap between raw numbers and human understanding. Datavzrd shows how open-source innovation can make this possible:
- It empowers researchers without programming skills.
- It enables transparent, accessible data sharing.
- It supports reproducibility in science by making results easier to explore and verify.
By combining simplicity, power, and openness, Datavzrd could become a valuable companion for researchers, educators, and analysts across the globe.


GIPHY App Key not set. Please check settings